Want to get an overview of your collection?
The Statistics function in Sierra provides field data reports on ranges of records or records contained in a review file. To see your own records or a subset, use the directions below to run a report for your collection. The example below is using Esopus.
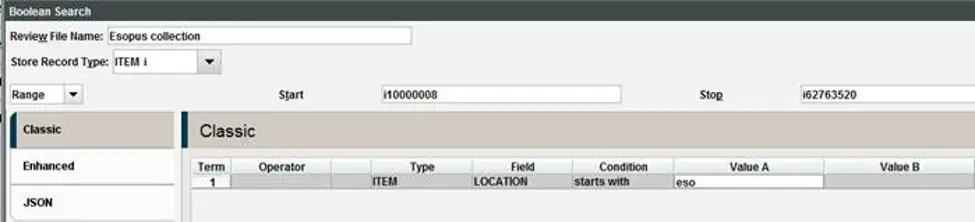
1. Create a list of all your library’s items.
2. Use Statistics to create a field report on the records you gathered in create list. Statistics is a great way to pull together the field values of a group of records.
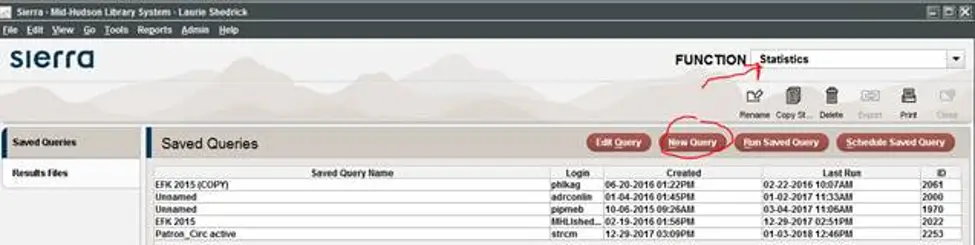
3. Select Statistics from Functions
4. Choose new query
Sierra Statistics
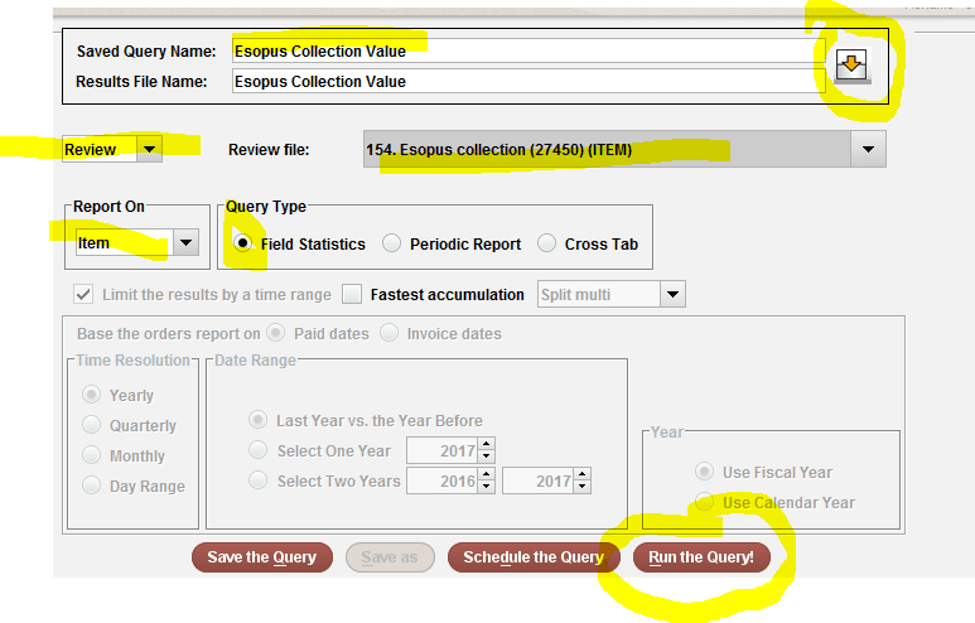
- Build the report by entering as you see below
- Name the report
- Hit the down arrow to name the results the same or type what you prefer
- Report on a “review” and then find the file you created. You may also run this on your barcode index using your item prefix, but this way works too
- Choose field statistics
- Choose run the query
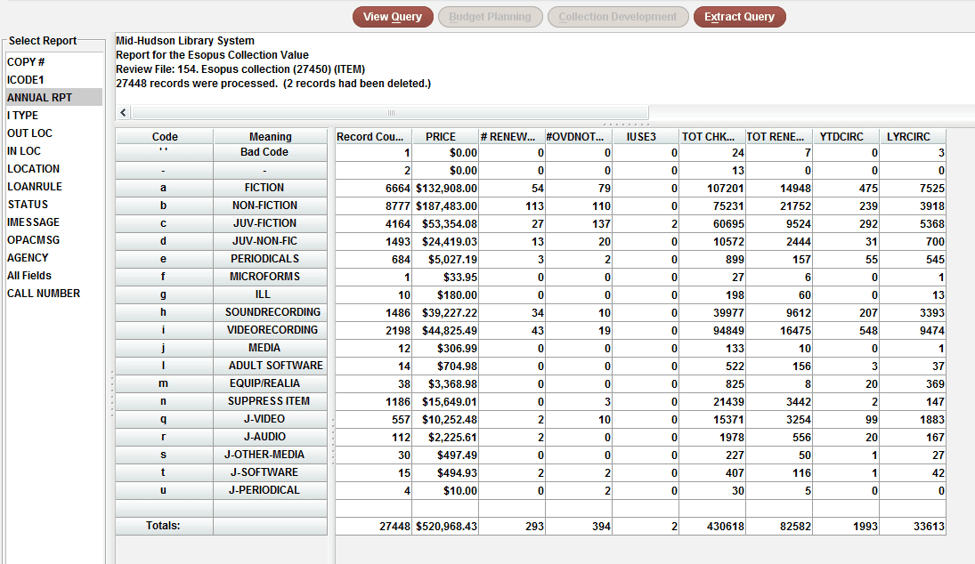
Your report will be the last report on the list, double click or highlight and click “view report”. The report can be viewed based on a number of indexes. I chose “Annual report” here: